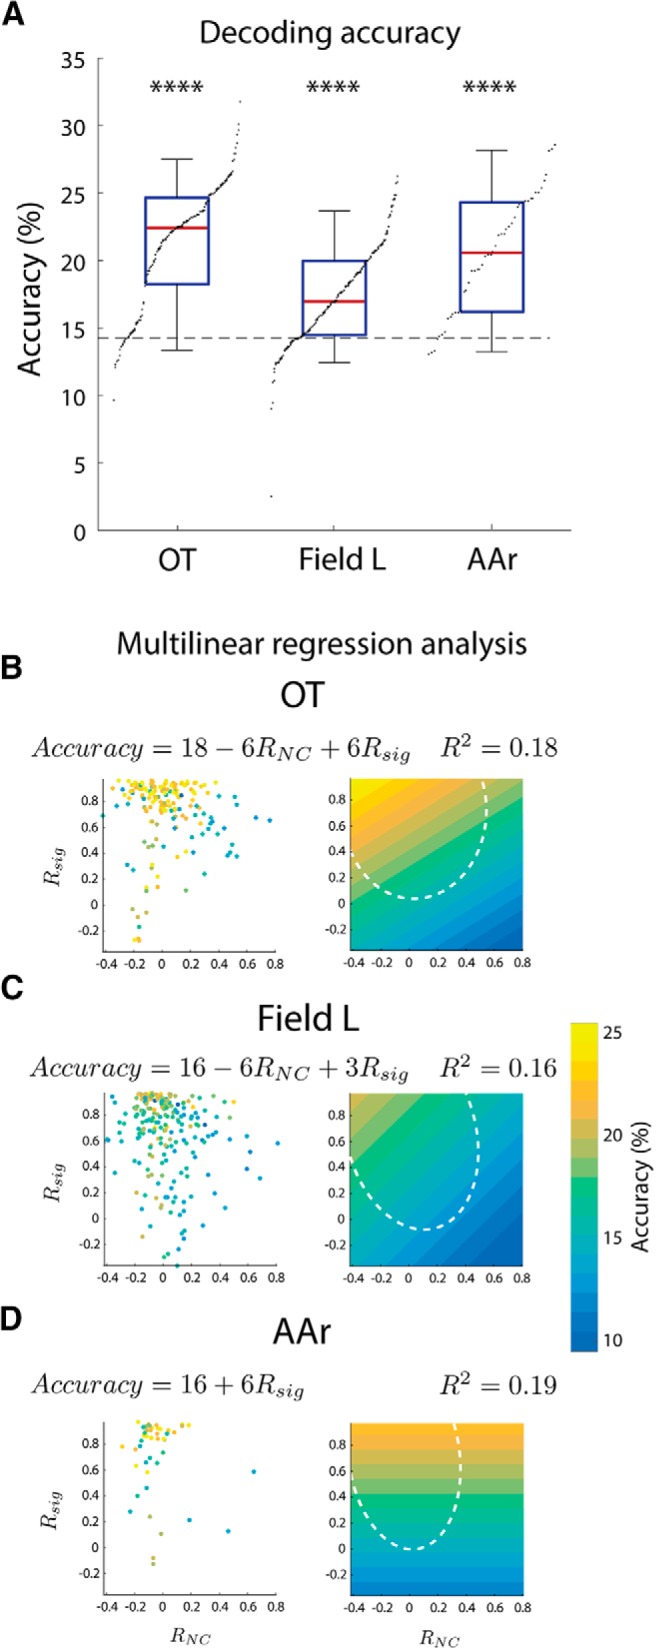
Figure 8.

Decoding of ITD and azimuth from firing rate. A, Decoding accuracy in pairs of simultaneously recorded units in OT, Field L, and AAr. Box plots represent median (red line), interquartile range (blue), and 5% and 95% quantiles (whiskers). Asterisks indicate better than chance level decoding of azimuth (dashed line: 14.92°). Dots are the sorted data points. B–D, left, Decoder performance (colored points) plotted against signal (Rsig) and RNC for each pair of neurons in OT (B), Field L (C), and AAr (D). Point color indicates level of accuracy (color bar on the right). Right, Linear fit of accuracy data as a function of signal and RNC. White dashed ellipsoids depict 95% range of signal and RNCs used for the linear fit, which avoided outliers. Fit functions and R 2 values are shown above each plot. Color bar matches all plots (****p < 0.0001; Wilcoxon signed-rank test).
