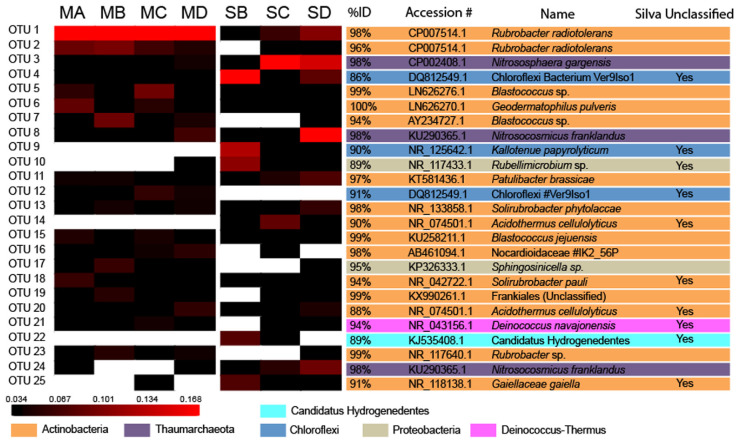
FIGURE 3.
Heatmap of Operational Taxonomic Unit Abundance. Heatmap analysis of OTU abundance in meteorites and soil samples. Analysis performed for OTUs at a distance of ≤0.03. The scale bar represents the fractional abundance of each OTU within each sample. The identity score, accession number, and the name of the nearest named isolate according to NCBI BLAST are indicated beside the heatmap. OTUs that were unable to be classified beyond the level of the domain Bacteria in the Silva database are also noted.

