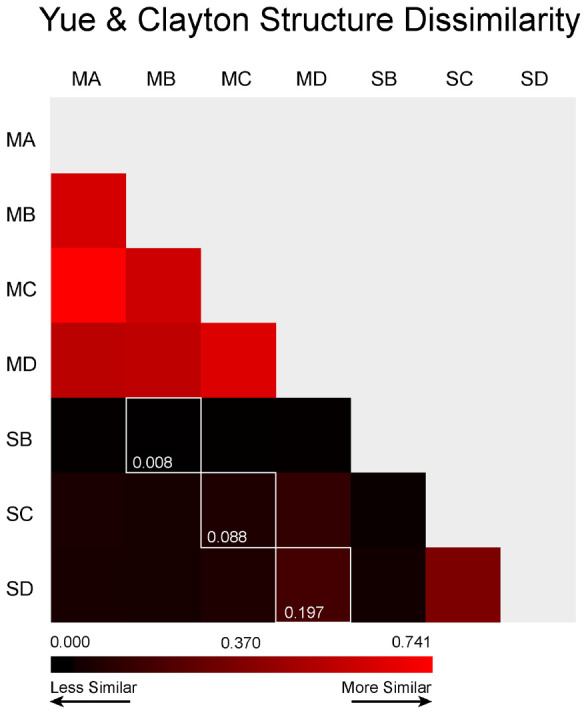
FIGURE 6.

Community Structure Dissimilarity. This calculation was made using Yue and Clayton (2005) indices at a clustering distance of ≤0.03. The colors are scaled to the highest level of similarity between any two samples (red) and the lowest level of similarity (black). The white outline represents the direct comparison between the meteorite and its underlying soil.
