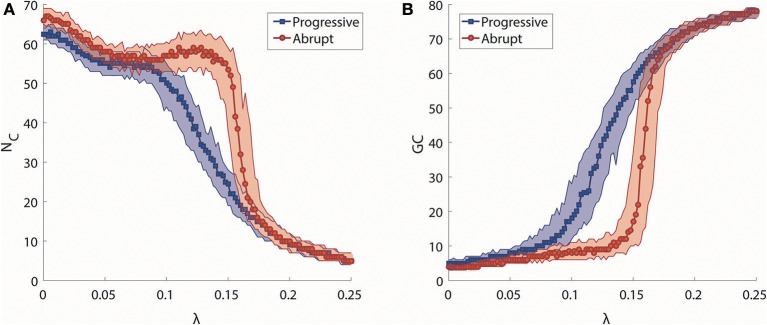
Figure 3.
Analysis of synchronization clusters. (A) Change in the median number of synchronization clusters (NC) as a function of λ in progressive (blue) and abrupt (red) transitions. Colored area indicates the 25–75% values. (B) Change in the median size of a giant synchronization cluster (GC) as a function of λ in progressive (blue) and abrupt (red) transition. Colored area indicates the 25–75% values.

