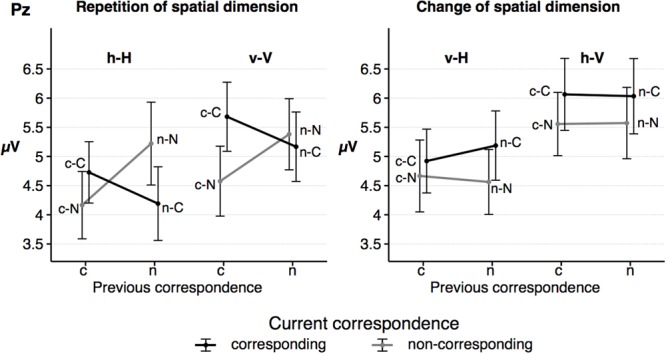
FIGURE 7.

The figure shows the mean amplitude of the parietal P3b as a function of dimensional repetition (left) and dimensional change (right) and current and previous correspondence. Error bars indicate the standard error of the mean. h = horizontal dimension, v = vertical dimension, c = corresponding S–R relation, n = non-corresponding S–R relation. Small letters indicate previous trial features, capital letters current trial features of a trial sequence.
