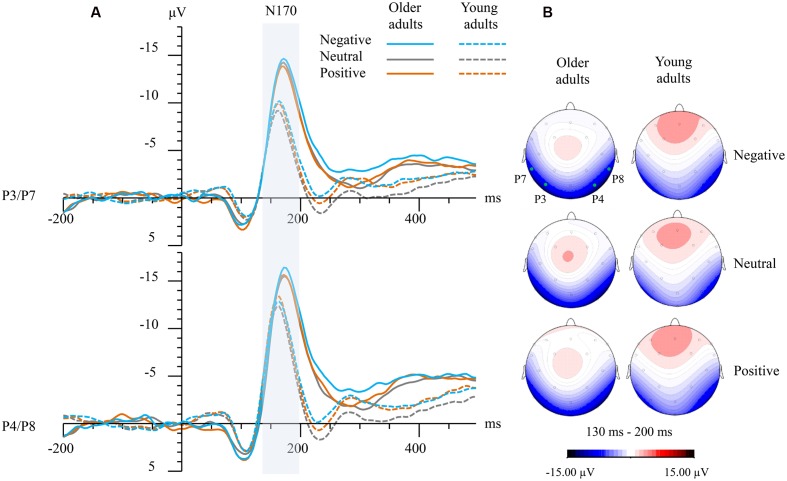
FIGURE 1.
(A) Grand-averaged event-related potential (ERP) waveforms elicited at left (averaged from P3 and P7) and right temporo-occipital electrodes (averaged from P4 and P8) for both groups and emotions. The vertical bar marks the time-windows that were analyzed as N170 in both age groups. (B) Topographical maps showing top view of scalp distributions over the N170 time-window for negative faces (top), neutral faces (medium), and positive faces (bottom). Note: the solid green points indicate the scalp electrodes where the P3, P4, P7, and P8 were located.

