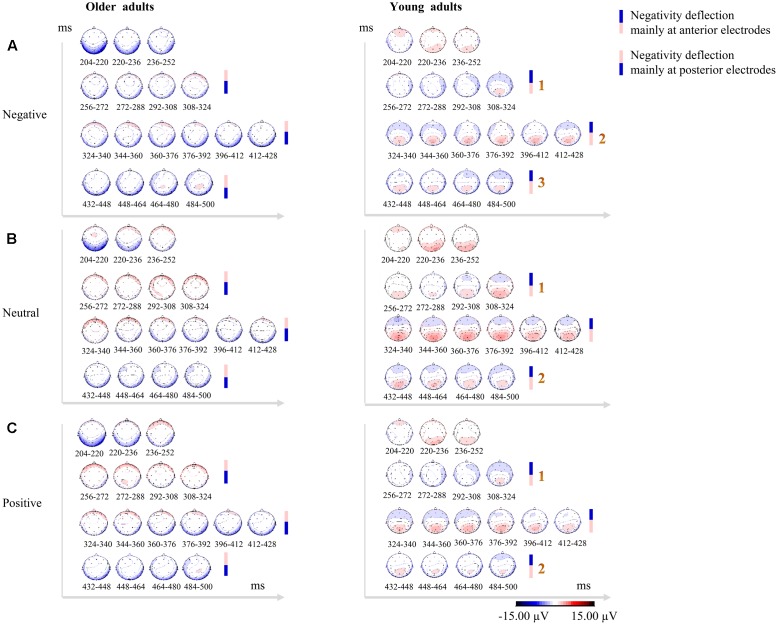
FIGURE 2.
Topographical maps in consecutive 16-ms bins over the time range of 200–500 ms post-stimulus showing qualitative between-group differences in scalp distributions across 32 electrodes for negative faces (A), neutral faces (B), and positive faces (C). Older adults exhibited sustained temporo-occipital negativity deflections (mainly at posterior electrodes), while young adults showed clear posterior positivity over P2 time-window and subsequent frontal negativity deflections (mainly at anterior electrodes). The negativity deflections in young adults were thrice enhanced (scalp voltage gradually increasing thrice) for negative faces, and twice enhanced (scalp voltage gradually increasing twice) for neutral and positive faces. Enhanced positivity for the stimuli is shown in red, while blue indicates enhanced negativity for the stimuli. The scale (–15/+15 μV) has been adapted to better display the topographical similarities and differences.

