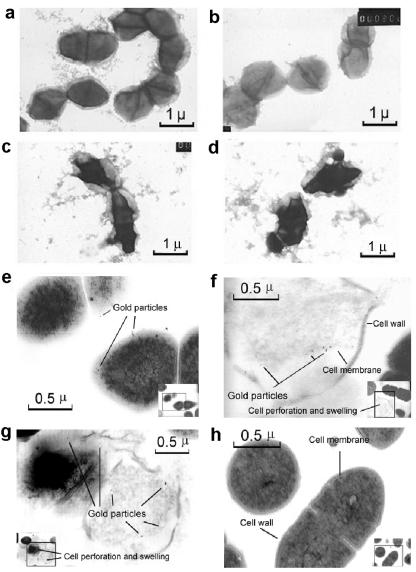
FIG. 3.
Electron micrographs of ATCC 700802 VRE cells. (a) Untreated cells. (b) Vancomycin-treated cells (5 μg/ml). (c and d) PMC-EF-treated cells (5 μg/ml). (a to d) Negative staining. Magnification, ×15,000. Cells were incubated and stained with rabbit anticolicin antibody and gold-labeled goat anti-rabbit antibody. (e to g) VRE cells were treated with PMC-EF (20 μg/ml). (h) Cells treated with PMC-EF (20 μg/ml) and competed with free cCF10 (1 μg/ml). Magnification, ×30,000 to ×40,000. Insets show full-field views.

