FIGURE 2.

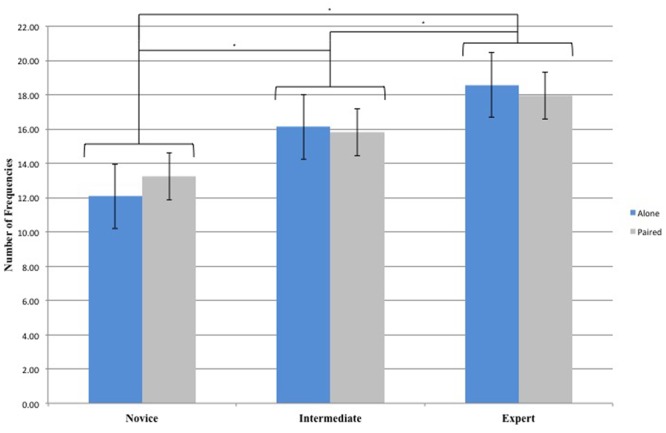
Number of Frequencies for the 3 Groups (Novice, Intermediate, and Expert) and the 2 Conditions (Alone and Paired). ∗Asterisks indicate significant differences P < 0.05.

Number of Frequencies for the 3 Groups (Novice, Intermediate, and Expert) and the 2 Conditions (Alone and Paired). ∗Asterisks indicate significant differences P < 0.05.