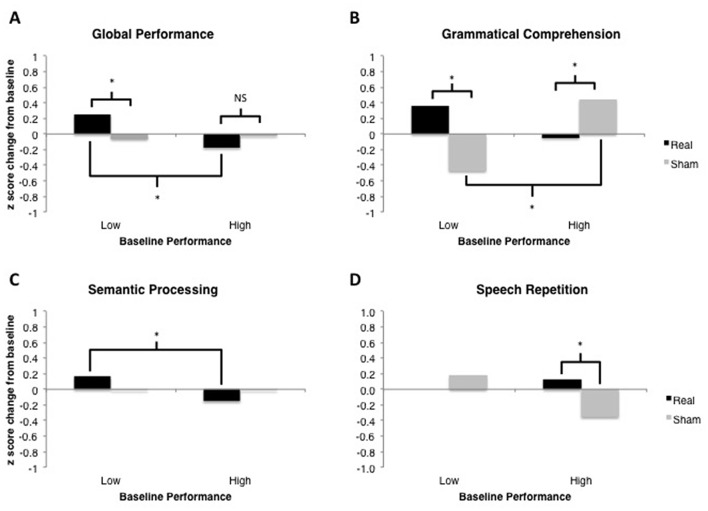
Figure 5.
Results of linear mixed-effects tDCS × Baseline Performance analyses for each language domain of interest. Model-estimated means are plotted in units of z-scores measured as change relative to the most recent baseline (i.e., standardized different scores). Asterisks represent significant comparisons at the p < 0.05 level. (A) Global Performance of low and high performers at baseline. (B) Grammatical Comprehension of low and high performers at baseline. (C) Semantic Processing of low and high performers at baseline. (D) Speech Repetition of low and high performers at baseline.

