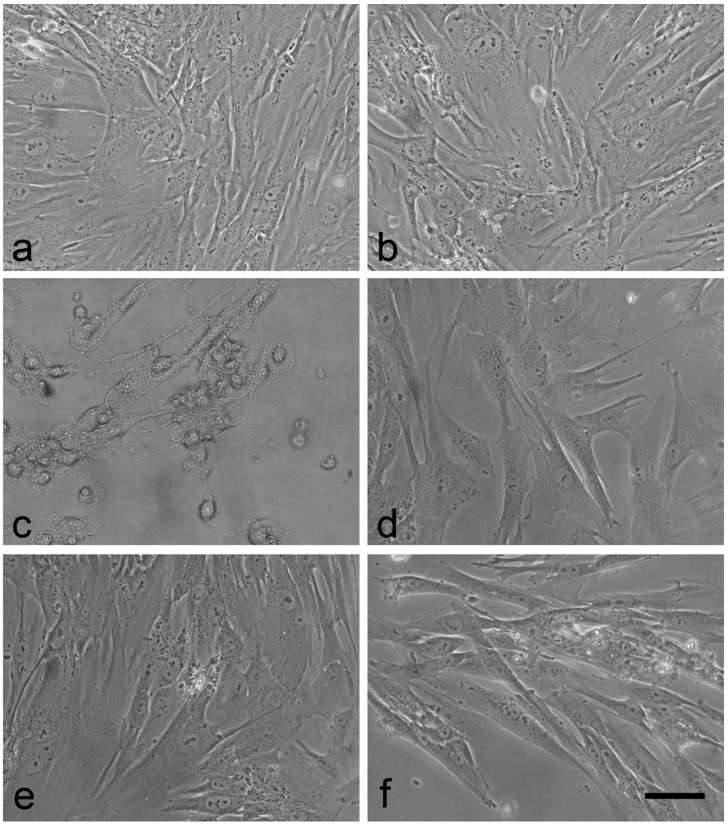
Figure 5.
Images of untreated controls (a) and cells positioned in the vicinity of the samples: negative control (b), positive control (c), manipulated cotton swab (d), ICS1 (e), and ICS2 (f). Healthy MRC-5 cells show the elongated form of normal fibroblasts. Upon damage they round up and eventually detach from the plastic surface (c). Scale bar: 50 µm.

