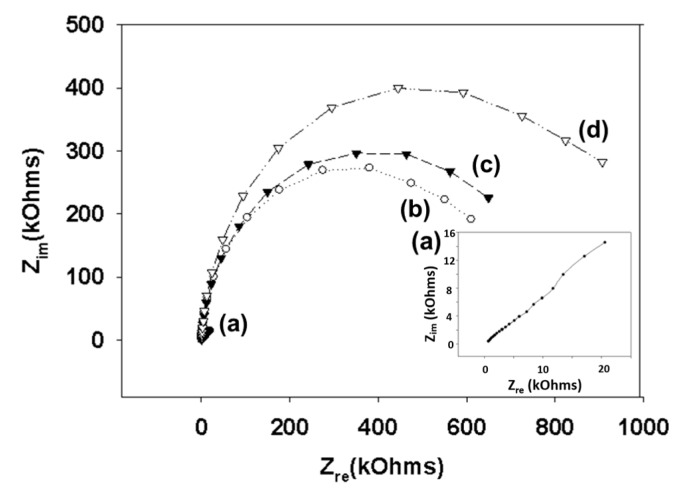
Figure 3.
Nyquist diagram (Zim vs. Zre) for the Faradaic impedance measurement of a sensing chip in PBS (pH 7.4) containing 2 mM [Fe(CN)6]3−/4− over the course of the surface functionalization reaction. A gold electrode (a) was treated with 11-mercapto-1-undecanol (b), epichlorohydrin (c), and mucin (d). Impedance spectra were measured within the frequency ranging from 0.1 to 1000 Hz at the formal potential of the [Fe(CN)6]3−/4− redox couple. The amplitude of the alternative voltage was 5 mV. The inset shows an enlarged plot for a bare gold electrode.

