Figure 3.
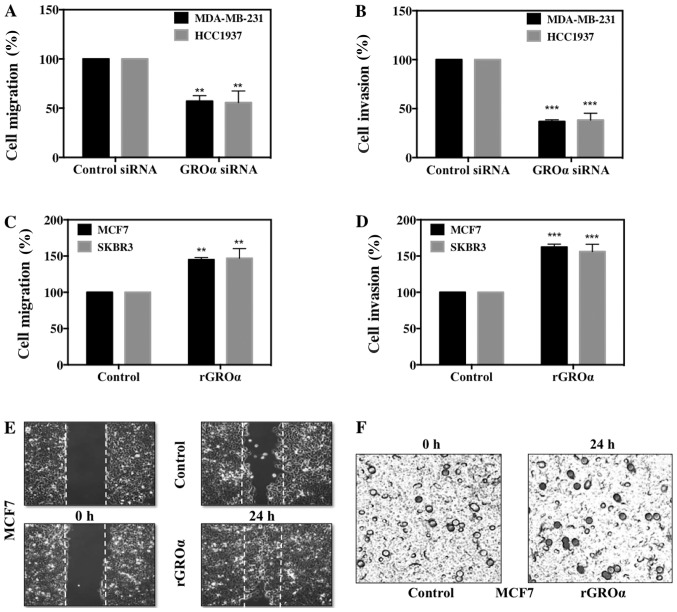
GROα promotes breast cancer cell migration and invasion. Cell migration rates were determined by scratch assay in GROα specific siRNA (100 nM) knocked down (A) MDA-MB-231 cells and HCC1937 cells and recombinant GROα-stimulated (1 ng/ml) (C) MCF7 and SKBR3 cells after 24 h by comparing with their respective controls, scrambled siRNA or vehicle (water) respectively. Images were captured at 0 h and 24 h of wound healing process and presented as percentage cell migration. Cell invasion rates were determined by Boyden chamber Matrigel invasion assay by placing treated cells in serum-free medium in the upper chamber and 10% FBS containing medium in the lower chamber. After 24 h, bluish-black cells stained with toluidine blue indicating cell invasion into the Matrigel were counted in three fields of view per chamber and presented as percentage cell invasion in GROα specific siRNA (100 nM) knocked down (B) MDA-MB-231 cells and HCC1937 cells; and recombinant GROα (1 ng/ml) stimulated (D) MCF7 cells and SKBR3 cells after 24 h compared to their respective controls, scrambled siRNA and vehicle (water). Representative images for GROα-stimulated MCF7 cell migration (E) and invasion (F) assays. For invasion assays, the images were captured at 20x where the darkly stained dots represented the invaded cells that passed through the porous membrane matrix. Experiments were performed at least twice with triplicates per experimental analysis. Bars correspond to mean ± SD, n=3, **p<0.01, ***p<0.001 (paired t-test, sample vs. control).

