Figure 2.
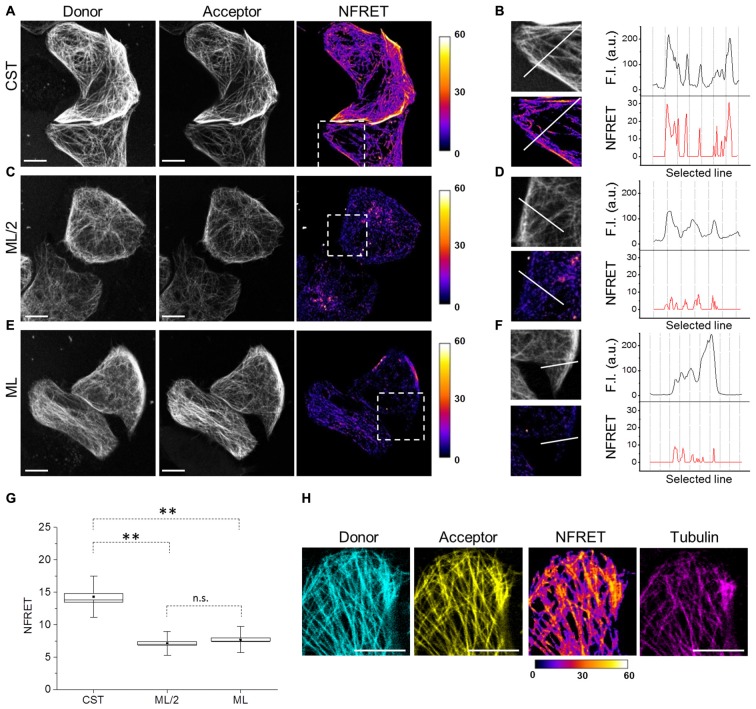
Tau conformation on microtubules (MTs) by Foster Resonance Energy Transfer (FRET). (A) FRET measurements in CST reporter HeLa cells. Donor (gray), acceptor (gray) and Normalized FRET (NFRET) images (false color). White scale bar = 10 μm. (B) Magnification of the outlined box in (A). Fluorescence intensity profile (F.I.) along the white line (black graph) and NFRET intensity profile along the white line (red graph). (C) FRET measurements in cells expressing ECFP-Tau and Tau-EYFP at comparable Tau levels to CST (ML/2). (D) Magnification of the outlined box in (C). F.I. along the white line (black graph) and NFRET intensity profile along the same white line (red graph). (E) FRET measurements in cells co-expressing monolabeled ECFP-Tau and Tau-EYFP at comparable fluorophore levels to CST (ML). (F) Magnification of the outlined box in (G). F.I. along the white line (black graph) and NFRET intensity profile along the white line (red graph). (G) Box plot of NFRET values calculated on MTs network in CST (40 cells), ML/2 (50 cells) and ML (60 cells). Box spans the standard error of the mean (black square) while whiskers indicates the standard deviation (**p < 0.001 ANOVA one-way test). (H) NFRET signal localization along MTs. Donor (blue), acceptor (yellow), NFRET (false color) and tubulin labeled with Sir-tubulin (magenta); Pearson coefficientdonor/Tubulin: 0.797; Pearson coefficientacceptor/Tubulin: 0.839; Pearson coefficientNFRET/Tubulin: 0.742. White scale bar = 10 μm.

