Figure 4.
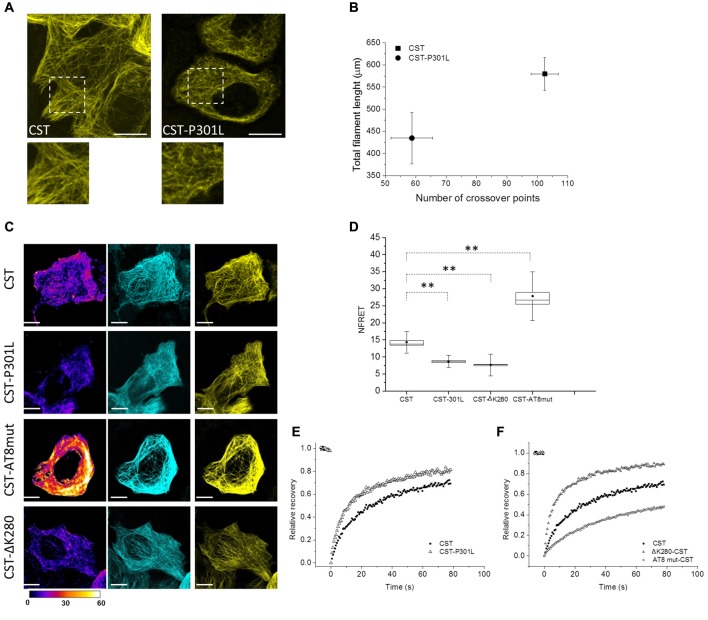
Impact of different point mutations on Tau conformation and mobility. (A) Confocal imaging of reporter cells (Acceptor channel, yellow) expressing CST and CST-P301L. White boxes are image magnifications. (B) Morphological analysis of fluorescent network density in reporter cells expressing CST (n = 10), CST-P301L (n = 10). Data shown are mean and SEM. (C) NFRET images (false color), donor (Blue), acceptor (yellow) of reporter cells. White scale bar = 10 μm. (D) NFRET quantification along MTs of cells expressing CST (n = 40), CST-P301L (n = 35), CST-∆K280 (n = 20) and CST-AT8mut (n = 20). Box spans the standard error of the mean (black square) while whiskers indicates the standard deviation (**p < 0.001 ANOVA one-way test). (E) FRAP relative recovery curves of CST and CST-P301L. (F) FRAP relative recovery curves of CST, CST-∆K280 and CST-AT8mut.

