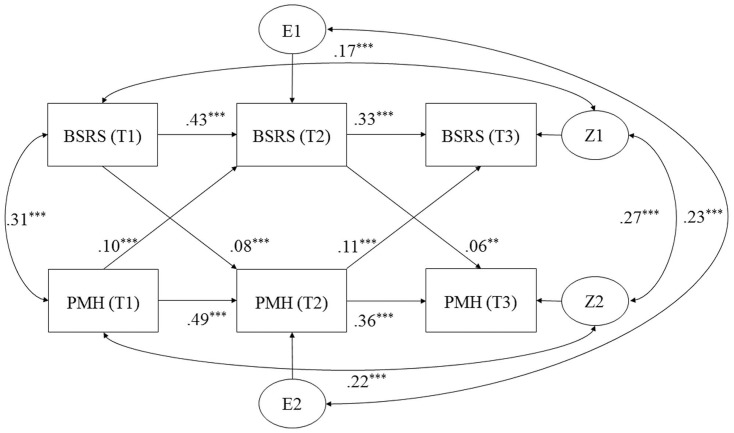
FIGURE 1.
Cross-lagged panel model for social rhythm measured by Brief Social Rhythm Scale (BSRS) and positive mental health measured by Positive Mental Health Scale (PMHS). T1, baseline; T2, 1-year-follow-up; T3, 2-year-follow-up; double-headed arrow, correlation; one-head arrow, regression. E1, E2, Z1, and Z2 represent the residual errors for BSRS (T2), PMHS (T2), BSRS (T3), and PMHS (T3), respectively. ∗∗p < 0.01; ∗∗∗p < 0.001.

