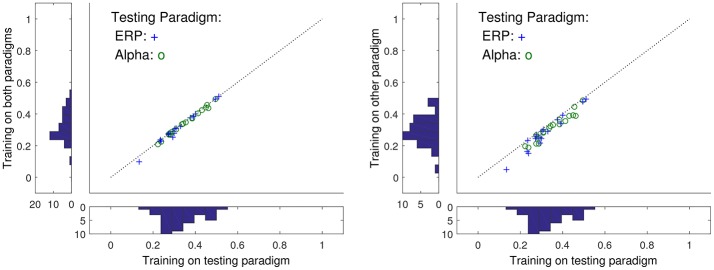
Figure 3.
The relation between ρ when the training and test sets are varied. For the x-axes are reported ρ when test and training sets come from the same task (ERP or alpha paradigms), while the values on the y-axes correspond to training data drawn from a different task. Histograms are marginal distributions. Left: Training data was here 2 min of alpha and ERP tasks (4 min in total). Right: Training was here 2 min of alpha/ERP for ERP/alpha test data.

