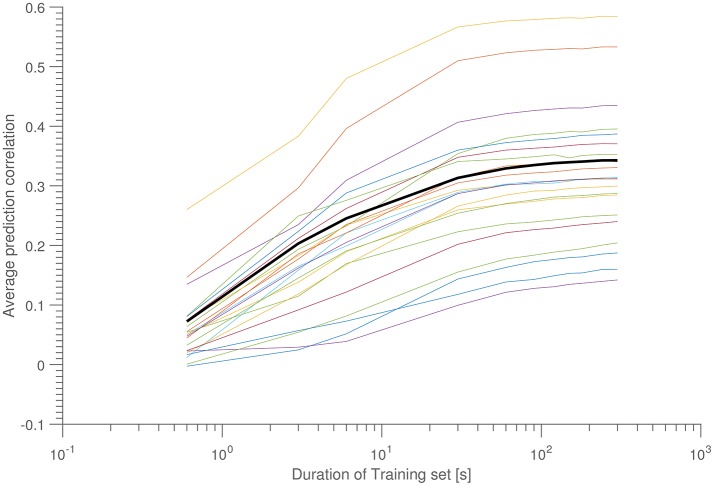
Figure 5.
Average correlation as a function of training set size. Each colored line corresponds to a 15-min data set, while the bold black line is the population average. Each data points consists of the average over 10 sets of 9 test data. All data was taken from the ERP-part of the “laboratory data set.”

