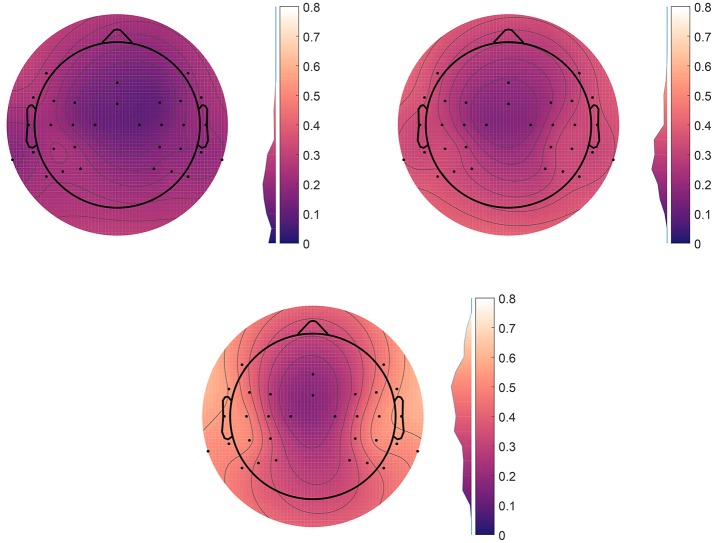
Figure 7.
Scalp plots of prediction correlation for each scalp channel, as predicted from ear-EEG data. We see that in the regions close to the ears, the mutual information is high. Each data point is the average correlation over both α and ERP paradigms, averaged over all 10 subjects. The histogram next to the color bar shows the distributions of the correlations before averaging. Top right: Using only the left ear. Top left: Decoupled ears. Bottom: Coupled ears, with common reference.

