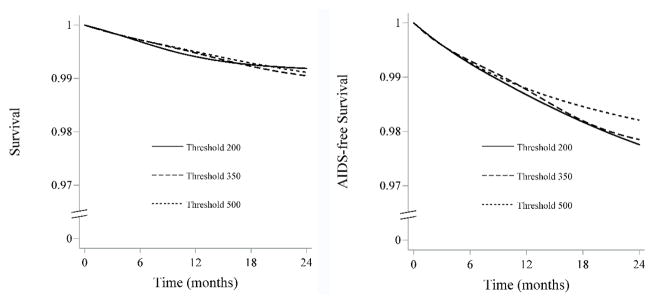
Figure 3.
24-month survival and AIDS-free survival curves by monitoring strategy, CNICS and HIV-CAUSAL Collaboration 2000–2015
The curves are standardized by the baseline covariates: sex, CD4 cell count (≤200, 201–350, 351–500, ≥501 cells/μl), years since HIV diagnosis (<1, 1–4, ≥5 years, unknown), race (white, black, other or unknown), geographic origin (N. America/W. Europe, Sub-Saharan Africa, other, unknown), acquisition group (heterosexual, homosexual or bisexual, injection drug use, other or unknown), calendar year (restricted cubic splines with 3 knots at 2001, 2007 and 2011), age (restricted cubic splines with 3 knots at 25, 39 and 60 years), cohort, and months from cART initiation to virologic suppression (2–4, 5–8, ≥9). We adjusted for potential selection bias induced by artifical censoring using inverse probability weighting.

