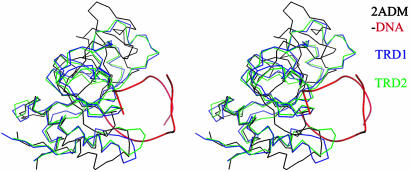
Fig. 3.
Stereogram of superposed TRD1 and TRD2 on the DNA binding domain of the TaqI-MTase. TRD1, TRD2, and TaqI-MTase are differentiated by colors, and the bound DNA backbone to the DNA binding domain of TaqI-MTase is displayed in red. The three globular structures superpose well especially in the DNA binding region.

