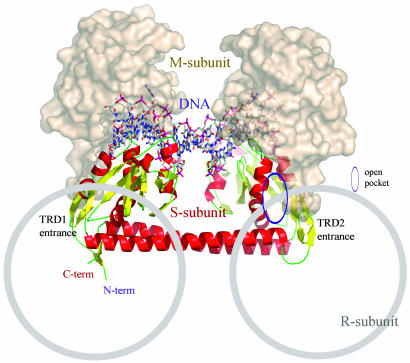
Fig. 7.
Model for subunit assembly. The S-subunit is drawn as a ribbon diagram, and the obtained DNA model shown in sticks. The M-subunit of the TaqI-MTase is drawn as a surface model and was docked around the TRDs of the S-subunit, based on the sequence similarity and functional features. The possible R-subunit binding regions drawn as gray circles are marked based on the structural features as well as the reported experimental data.

