Figure 2.
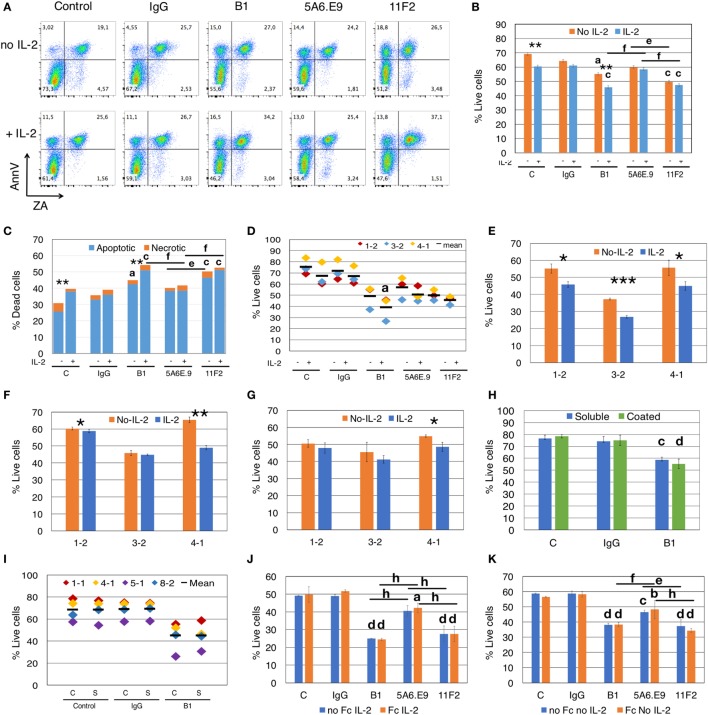
Anti-γδTCR antibodies induce apoptosis, and effects are exacerbated by interleukin-2 (IL-2). (A) Addition of IL-2 to blocking assays increases apoptotic cell death of γδ T cells (Donor 1, culture 2 = 1-2). Apoptotic cells are annexinV (AnnV) positive; early apoptotic cells are in the top left quadrant. Positive staining for Zombie Aqua (ZA) indicates dead cells. (B) For the experiment shown in panel (A), % live cells are plotted for γδ T cells treated with antibodies for 4.5 h in the presence or absence of IL-2. Error bars are SD for technical replicates. This experiment is representative of three biological replicates. (C) Most cell death induced by antibody treatment is apoptotic cell death (blue) and is enhanced in the presence of IL-2; orange indicates necrotic cell death. The graph depicts results from the experiment shown in panels (A,B). (D) Compiled results of experiment shown in panel (B) from three different donor cultures (1-2, 3-2, and 4-1). (E) Individual experiments in which γδTc were incubated with B1, (F) 5A6.E9 or (G) 11F2. In panels (E–G), Student’s t-tests reveal a significant difference in cell viability in the presence or absence of IL-2; *P < 0.05, **P < 0.01, ***P < 0.001. (H) No differences in cell death were induced by soluble or immobilized (coated) B1 antibody treatment; however, significant cell death is observed comparing soluble B1- to IgG-treated cells. This is a representative example of three independent experiments; for this experiment, cells were from culture 1-1 on day 16. (I) Compiled results of experiment shown in panel (F) with four different donor cultures (1-1, 4-1, 5-1, and 8-2). (J) A representative example of two independent experiments in which γδ T cells were incubated with or without Fc blocking reagent for 10 min at room temperature prior to the addition of antibodies in the presence of IL-2. Shown here is the experiment with donor culture 8-2. (K) The experiment in panel (J) carried out in the absence of IL-2. Statistical analyses for all but panels (E–G) were as follows: two-way ANOVA followed by Bonferroni’s multiple comparisons tests were performed to identify significant differences between antibody-treated and IgG-treated cells (aP < 0.05; bP < 0.01; cP < 0.001; dP < 0.0001) or among antibody treatments (line indicates groups compared; eP < 0.05; fP < 0.01; gP < 0.001; hP < 0.0001) as well as to determine significant viability differences in the presence or absence of IL-2 (*P < 0.05, ***P < 0.001).

