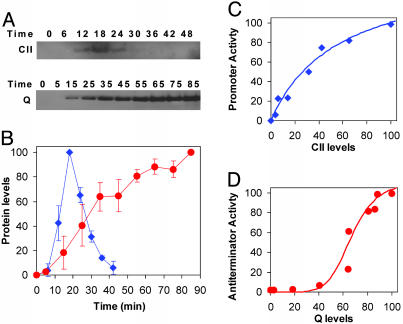
Fig. 2.
Promoter activity vs. regulatory protein levels. (A) Western blots for CII after infection with λc+ and Q after infection with λcII– carried out on samples taken from multiwell plate experiments at the indicated times and resolved on NuPAGE 4–12% Bis-Tris precast gels (Invitrogen). (B) CII (blue) and Q (red) levels as a function of time. Levels and their SD were determined with the National Institutes of Health image program, from two different experiments. The level of Q protein after infection with λc+ reached ≈20% of that observed in λcII– infection (data not shown). (C and D) Promoter activities of pE after infection with λc+ (C) and pR′-tR′ after infection with λcII– (D), as calculated from fluorescence measurements, vs. CII and Q concentrations, respectively. Cultures were infected at a moi of 6. Fluorescence measurements and protein levels were measured from the same infections under identical conditions. The lines represent a fit to the data by using a Hill function, with a fitted Hill coefficient H = 0.98 ± 0.15 (C) and H = 6.4 ± 3.3 (D) (see Materials and Methods).

