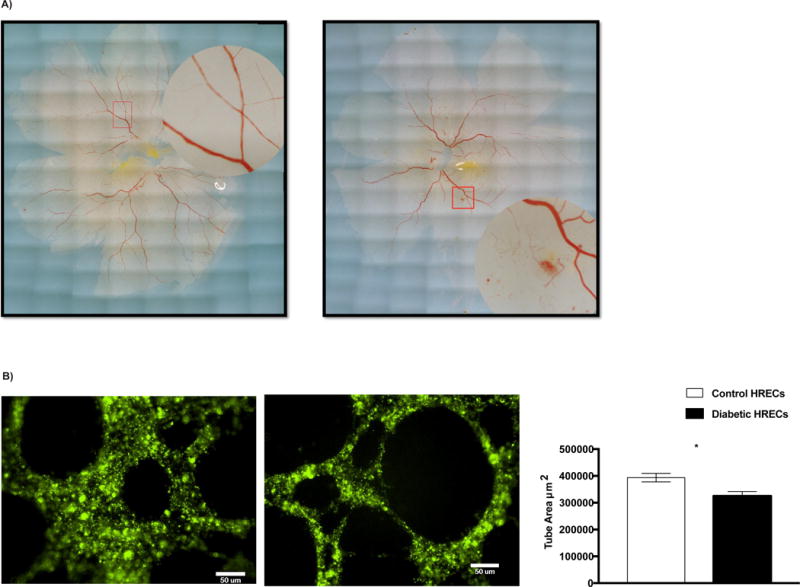
FIG. 2. Diabetes impairs tube formation capacity of HRECs.

(A) Postmortem imaging of human retina. Control retina with well-organized blood vessels (left), Diabetic retina with signs of NPDR; intraretinal hemorrhages and microaneurysms (right). (B) An in vitro tube formation assay was performed in control (n=4) and diabetic (n=7) HRECs using Matrigel Matrix 96-well plate. Representative images of tube-like structures are shown. The cells were stained with Qtracker 525 (green), images were taken in 10× magnification and total tube areas were calculated using MetaMorph software system. Quantification of tube area is shown on far right. Data are means ± SEM. *P < 0.05, significantly different as determined by Student’s t -test. Scale bar = 50 μm.
