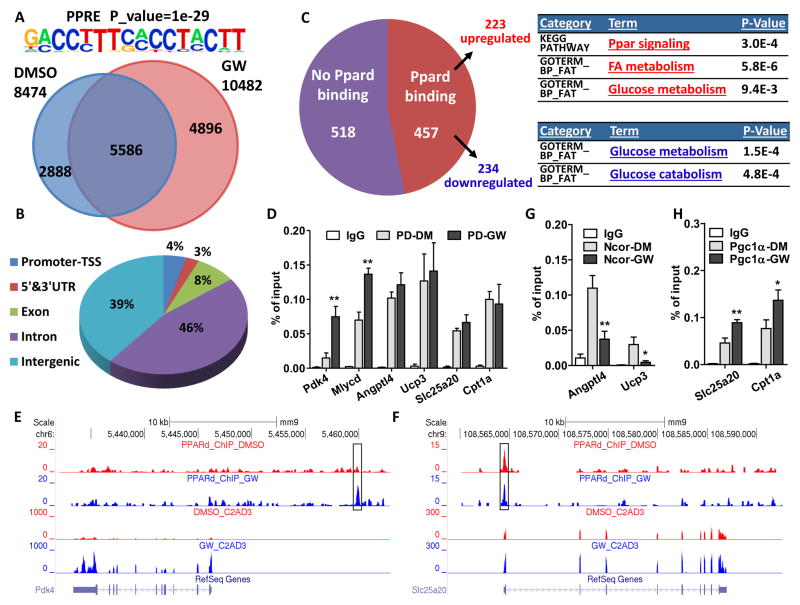
Figure 4. Ligand Remodeling of the PPARδ cistrome.
Experiments were performed in 5-day-differentiated C2C12 myotubes with 6-hour treatment of DMSO or GW. (A) Venn diagram showing distinct and overlapping binding sites of PPARδ in C2C12 myotubes with DMSO or GW treatment. PPRE motif (top) was significantly enriched. (B) Pie chart illustrating genomic locations of PPARδ binding sites in the DMSO-treated condition. GW treatment gave similar results. (C) Pie chart showing the number of PPARδ-bound or non-bound genes from all 975 genes that are changed by GW treatment. GO and pathway analysis of up- and down-regulated genes is listed. (D) ChIP-qPCR showing PPARδ binding sites that are enhanced by GW treatment or not. IgG: IgG control; PD-DM: PPARδ-ChIP in DMSO treatment; PD-GW: PPARδ-ChIP in GW treatment. (E–F) ChIP-Seq and RNA-seq reads aligned to Pdk4 (left) and Slc25a20 (right). (G–H) ChIP-qPCR showing the changes of NcoR (E) and Pgc1α (F) binding sites by GW treatment. IgG: IgG control; Pgc1α/Ncor-DM: Pgc1α/Ncor-ChIP in DMSO treatment; Pgc1α/Ncor-GW: Pgc1α/Ncor-ChIP in GW treatment. *p < 0.05, **p < 0.01.

