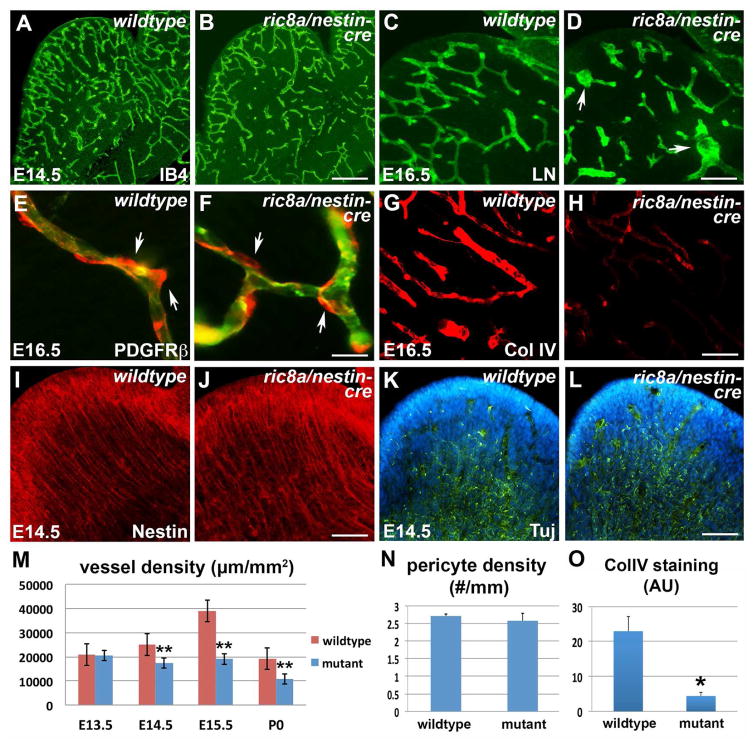
Figure 2. Ric8a mutation results in primary vascular defects in the embryonic LGE.
See also Figure S2.
(A–B) IB4 labeling shows LGE vascular defects in ric8a; nestin-cre mutants (B) in comparison to wildtype (A) at E14.5.
(C–D) Anti-laminin staining shows glomeruloid structures (arrows) in mutant LGE (D) at E16.5.
(E–F) Anti-PDGFRβ staining (red) shows similar pericyte (arrows) coverage along vessel (IB4, green) in wildtype (E) and mutant LGE (F).
(G–H) Anti-collagen IV staining shows defective basement membrane maturation in mutants (H) in comparison to wildtype (G).
(I–J) Anti-Nestin staining shows comparable radial glial scaffold between wildtype (I) and mutant (J) LGE at E14.5.
(K–L) Anti-Tubulin βIII (Tuj) staining shows comparable neuronal development between wildtype (K) and mutant (L) LGE at E14.5.
(M) Quantification of vessel density in wildtype and mutant LGE during embryogenesis. **, p < 0.01; n = 3.
(N) Quantification of perciyte density along vessels in wildtype and mutants (p = 0.59, n = 5).
(O) Quantification of collagen IV staining intensity shows significant reductions in mutants. *, p < 0.05; n = 4. AU, arbitrary units.
Scale bar: 200 μm for A, B, K, L, N and O, 100 μm for D, E, J and I, and 50μm in F and G.

