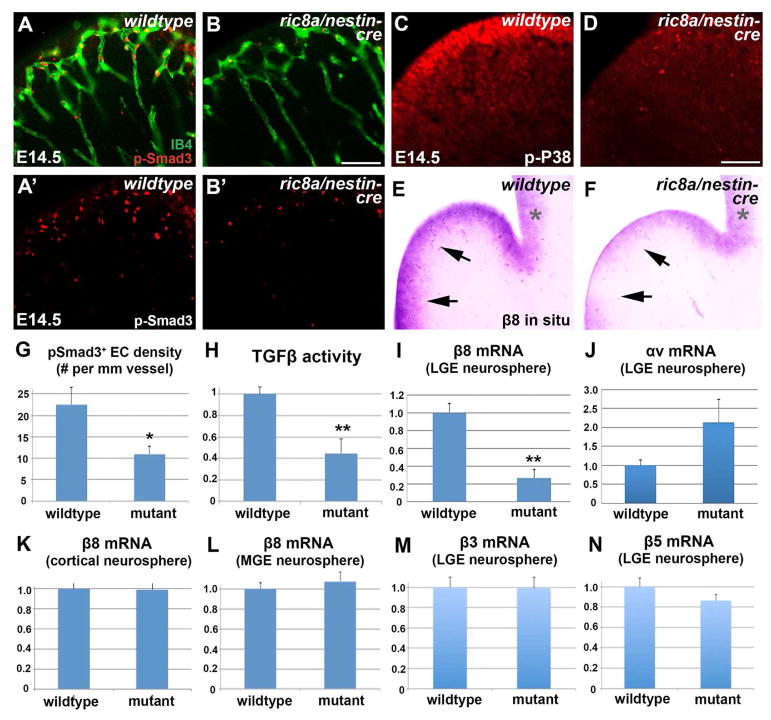
Figure 3. Compromised vascular TGFβ signaling and neural progenitor β8 expression in ric8a mutant LGE.
See also Figure S3.
(A–B′) Phospho-Smad3 (red) staining shows reduced TGFβ signaling along LGE vessels (IB4, green) in mutants (B & B′) compared to wildtype (A & A″). Phospho-Smad3 staining alone is shown in A′-B′.
(C–D) Phospho-p38 staining shows reduced p38 activity in LGE VZ in mutants (D) compared to wildtype (C).
(E–F) In situ hybridization shows reduced β8 mRNA levels in LGE VZ in mutants (F) compared to wildtype (E). Note similar levels in cortical VZ (*).
(G) Quantification of phospho-Smad3 EC density shows reductions in mutants. *, p < 0.05; n = 6.
(H) TGFβ activity, assayed using a reporter cell line, is reduced in mutant striata. **, p < 0.01; n = 6.
(I–J) RT-qPCR analysis shows significant reductions of β8 but not αv mRNA in mutant LGE neurospheres. **, p < 0.01; n = 5.
(K–L) RT-qPCR analysis shows no significant changes in β8 mRNA in either mutant cortical (K) or mutant MGE (L) neurospheres (p > 0.58; n = 4-10).
(M–N) RT-qPCR analysis shows no significant changes of β3 (M) or β5 (N) mRNA in mutant cortical LGE neurospheres (p > 0.25; n = 4).
Scale bar: 150μm for A–B and 100 μm for I–L, O, and P.

