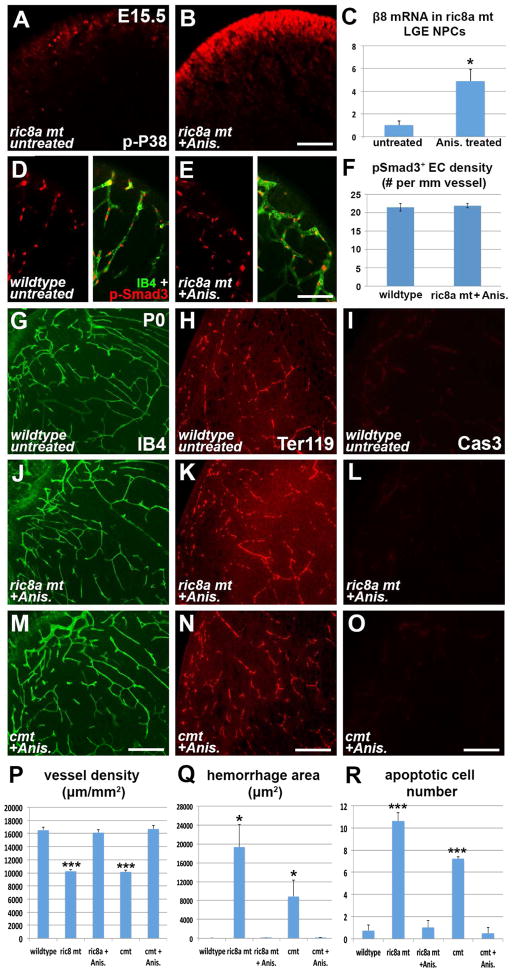
Figure 6. p38 activation rescues vascular defects in ric8a single and s1pr1/ric8a compound mutants.
See also Figure S6.
(A–B) Treatment with a low dose of anisomycin at E14.5 dramatically increases phospho-P38 (red) levels in mutant LGE (B) at E15.5 in comparison to the untreated (A).
(C) Anisomycin elevates integrin β8 mRNA in mutant LGE neurospheres despite ric8a deficiency. *, p < 0.05; n = 4.
(D–F) Anisomycin restores levels of phospho-Smad3 (red) along LGE vessels (IB4, green) in ric8a mutants (see Fig. 3B for untreated mutants) (D–E). Quantification shows a density of p-Smad3+ ECs indistinguishable from wildtype (F) (p > 0.68; n = 6).
(G, J, M, P) Anisomycin treatment at E14.5 restores vessel morphology (IB4, green) in P0 ric8a single (J) and s1pr1/ric8a compound mutant (M) striata, to levels similar to wildtype (G). Quantification confirms rescue of vessel density (P) (***, p < 0.001; n = 17).
(H, K, N, Q) Anisomycin treatment at E14.5 prevents hemorrhage (Ter119 for red blood cell, red) in P0 ric8a single (K) and s1pr1/ric8a compound mutant (L) striata. Quantification confirms suppression of hemorrhage (Q) (*, p < 0.05; n = 6).
(I, L, O, R) Anisomycin treatment at E14.5 suppresses cell death (caspase 3, red) in P0 ric8a single (L) and s1pr1/ric8a compound mutant (O) striata, to levels similar to wildtype (I). Quantification confirms suppression effects (R) (***, p < 0.001; n = 5).
Scale bars: 200μm in A, B, G, J, M, H, K, and N. 100μm in D, E, I, L, and O.

