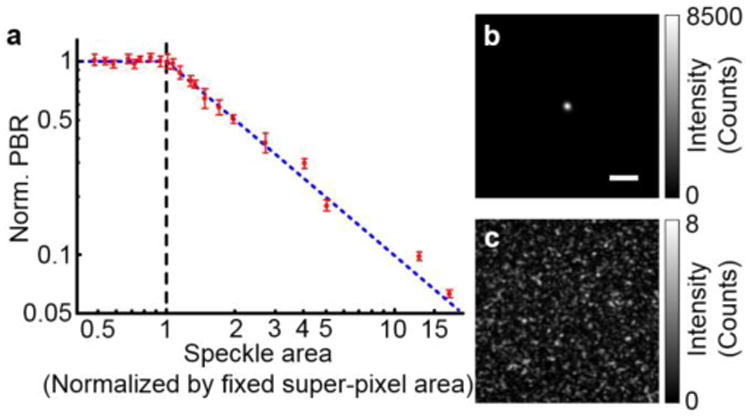
Fig. 5.

Experimental results obtained by varying the speckle size on a PCM while fixing the pixel size. a. Plot of normalized PBR as a function of speckle area. The horizontal and vertical axes are shown in the log scale. The blue dashed line indicates the theoretical prediction based on Eqs. (1) and (4). The error bars show the standard deviations obtained from three realizations of the scattering medium. b. Image of the achieved focus when the speckle area was 0.48× the pixel area. The PBR is 9100. Scale bar, 200 μm. c. No focus was observed when a random phase map was displayed on the SLM.
