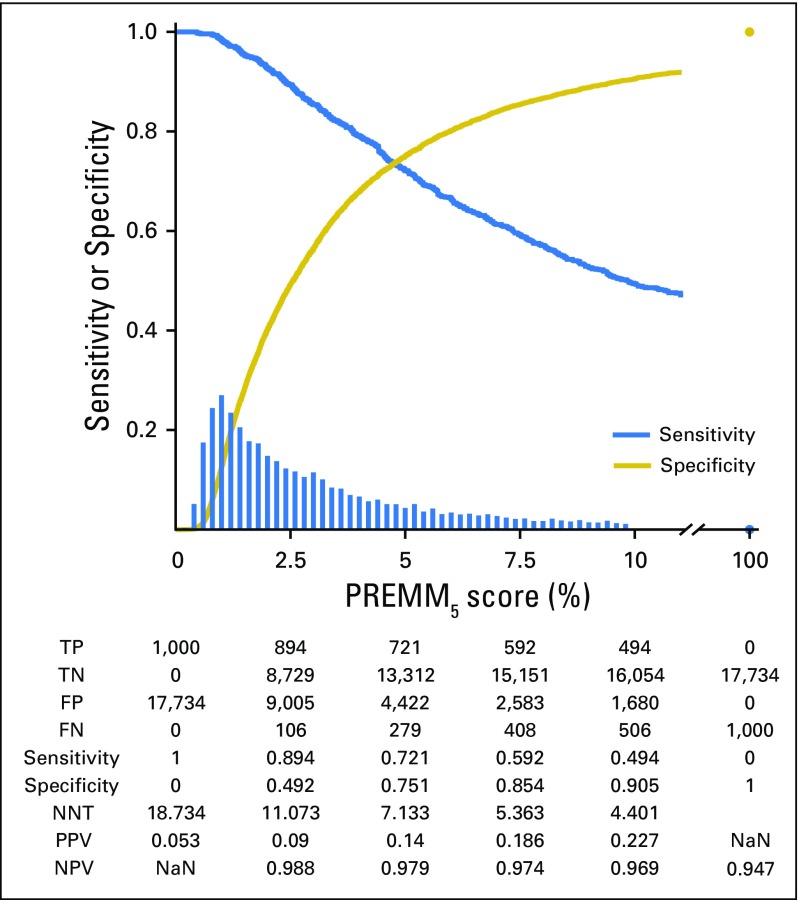
Fig 2.
Performance characteristics of PREMM5. Decreasing sensitivity and increasing specificity are shown for increasing risk thresholds for the PREMM5 score, with a histogram for the distribution of predicted risks. FN, false negative; FP, false positive; NaN, not a number; NNT, number needed to test; NPV, negative predictive value; PPV, positive predictive value; TN, true negative; TP, true positive. FN, FP, TN, and TP are reported for a given cutoff value on the PREMM5 score. NNT= (TP + FP) / TP.

