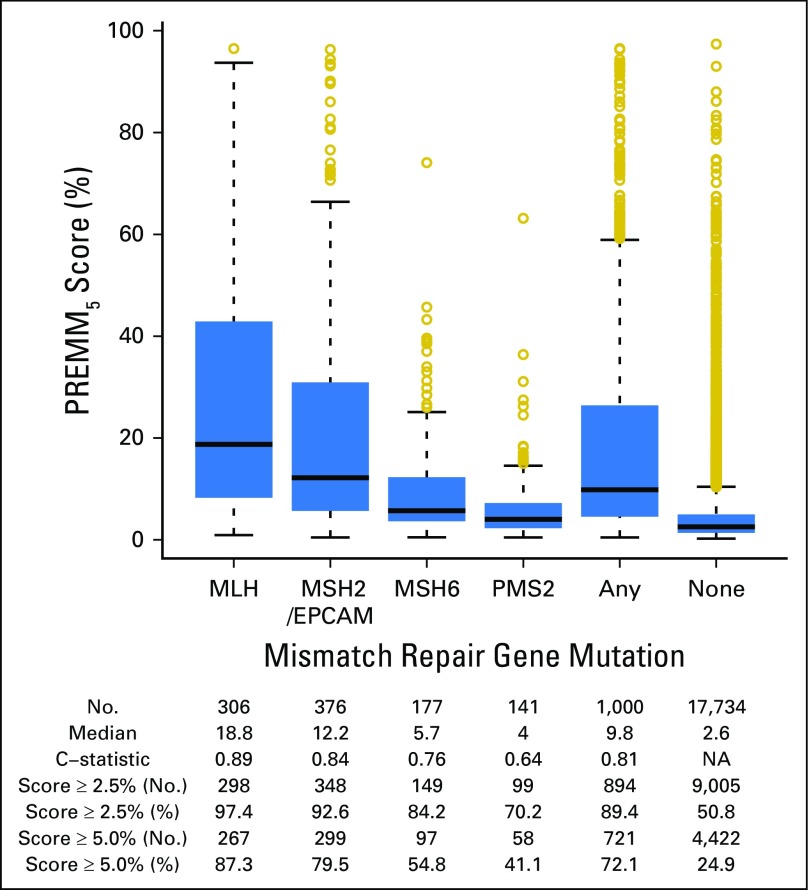
Fig 3.
Box plots of PREMM5 scores by specific gene mutation at model development. C-statistic: area under the receiver operating characteristic curve. Median values are represented by the horizontal lines in the boxes; 25th and 75th percentiles are represented by the lower and upper lines of the boxes, respectively. NA, not available.

