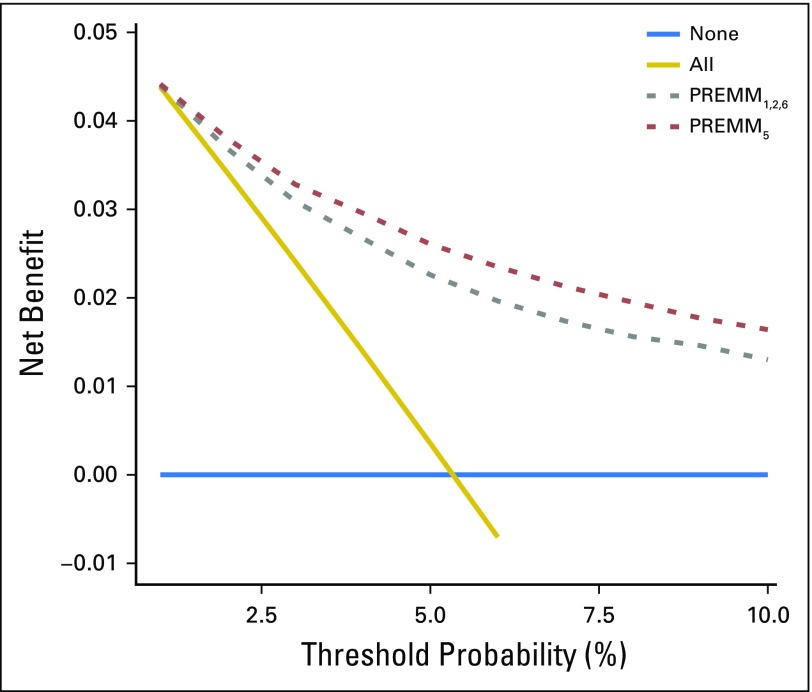
Fig 4.
Net benefit curves for PREMM5 compared with PREMM1,2,6. The y-axis measures net benefit, which is calculated by summing the benefits (true positives) and subtracting the harms (false positives), in which the latter are weighted by a factor related to the relative harm of a missed mutation carrier compared with the harm of unnecessary genetic testing. A model is considered of clinical value if it has the highest net benefit compared with other models and simple strategies, such as performing genetic testing in all patients (gold line) or no patients (horizontal blue line) across the full range of threshold probabilities at which a patient would undergo genetic testing. For example, the net benefit of using PREMM5 to selectively test for mutation carriers exceeds that of PREMM1,2,6, and testing all at risk threshold ≥ 2.5%.

