Fig. 1.

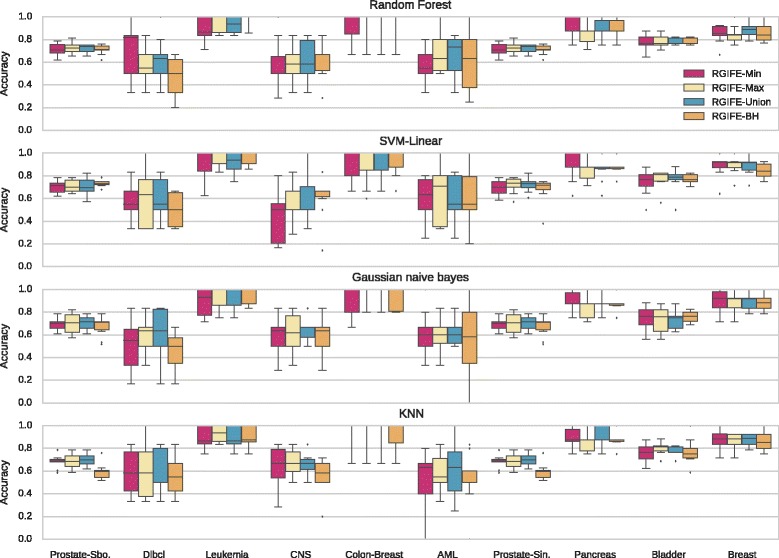
Distribution of the accuracies, calculated using a 10-fold cross-validation, for different RGIFE policies. Each subplot represents the performance, obtained with ten different datasets, assessed with four classifiers

Distribution of the accuracies, calculated using a 10-fold cross-validation, for different RGIFE policies. Each subplot represents the performance, obtained with ten different datasets, assessed with four classifiers