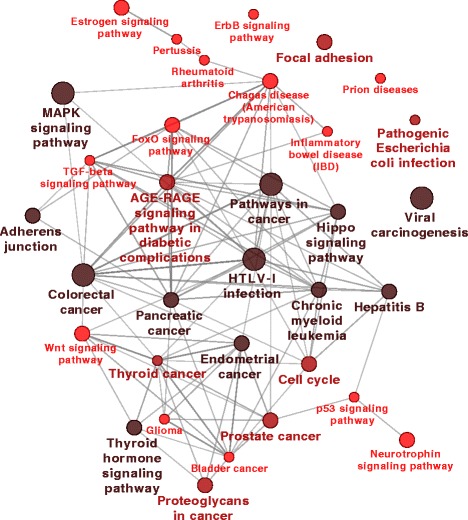
Fig. 7.

Graphical visualisation of the enriched terms (KEGG patwhays found by ClueGO) associated to the signature induced network nodes. Edges represent the relationship between terms based on their shared genes. The size of the node indicates the enrichment significance, the color gradient is proportional to the genes associated with the term. Only terms enriched with p-value < 0.05 are shown
