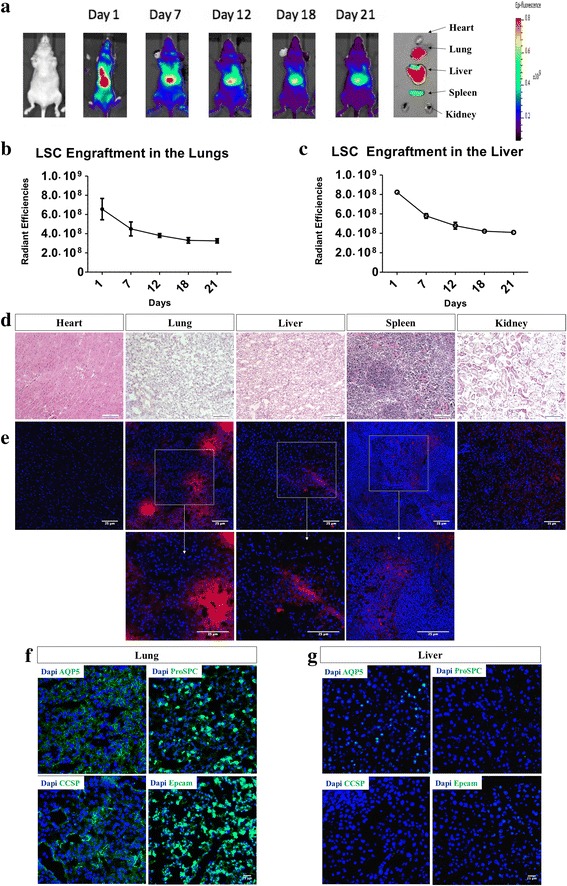
Fig. 5.

Biodistribution of LSCs in-vivo after intravenous injection. a: Representative in-vivo imaging of mice intravenously injected with LSCs at day 1, 7, 12, 18 and 21 along with final organ harvest of heart, lungs, liver, spleen and kidneys. b-c: Cumulative data for radiant efficiencies in the lungs sand liver. d-e: Representative hematoxylin and eosin staining (d) and immunohistochemistry (e) of heart, lung, liver, spleen and kidneys. Data represented as mean ± SD. f-g: Immunostaining of lung and liver tissue for lung specific markers AQP5, ProSPC, CCSP and Epcam. d: Scale Bar = 100 μm. e-g: Scale Bar = 25 μm. Immunostaining negative controls are provided in Additional file 4: Figure S4.
