TABLE 3.
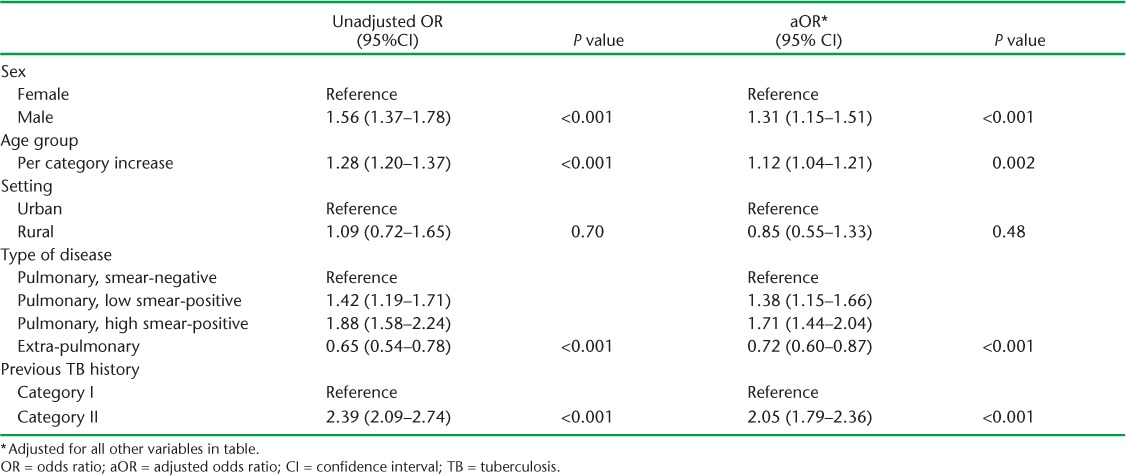
Unadjusted and adjusted OR for the association between explanatory variables and unfavourable treatment outcomes for all patients. All estimates are adjusted for clustering by treatment centre and state

Unadjusted and adjusted OR for the association between explanatory variables and unfavourable treatment outcomes for all patients. All estimates are adjusted for clustering by treatment centre and state
