
Fig. 1.
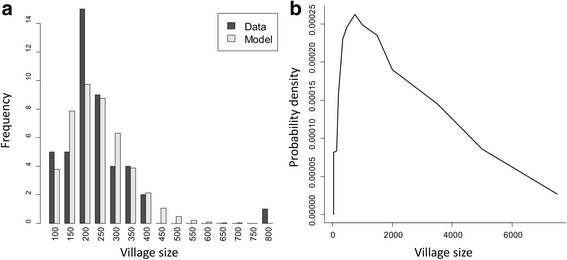
Distribution of village sizes in the Vellore study (a) and from the Indian census, 2001 (b). a Histogram of the Vellore data and the equivalent expectations for the fitted model (Parameters: mean = 263, aggregation parameter = 7.7. Labels give lower bounds of bins with width 50). b The Indian census distribution is an approximation from the number of communities in a range of size categories (mean = 2770, standard deviation = 1870)