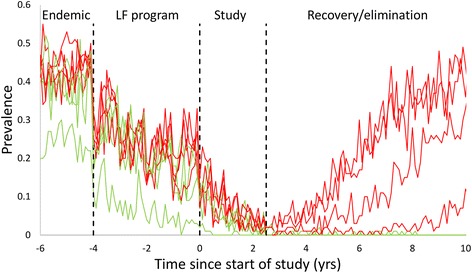
Fig. 2.

Time series of measured prevalence in a selection of individual communities within the stochastic simulation. Vertical lines indicate the four distinct regions of the simulation; endemic behaviour, LF treatment period, the duration of the study and the post-study period without MDA treatment. Red and green lines indicate communities that ultimately bounce back or eliminate, respectively
