
Fig. 5.
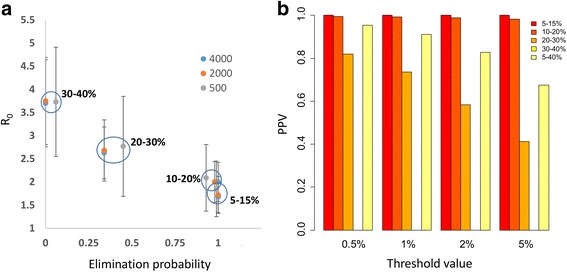
a Probability of elimination for communities with different baseline prevalence ranges and across a range of village population sizes. Error bars show 2 standard deviations for the R0 ranges of different baseline prevalence limits (indicated by circles). b PPV values for a range of elimination thresholds and baseline prevalences