Fig. 1.

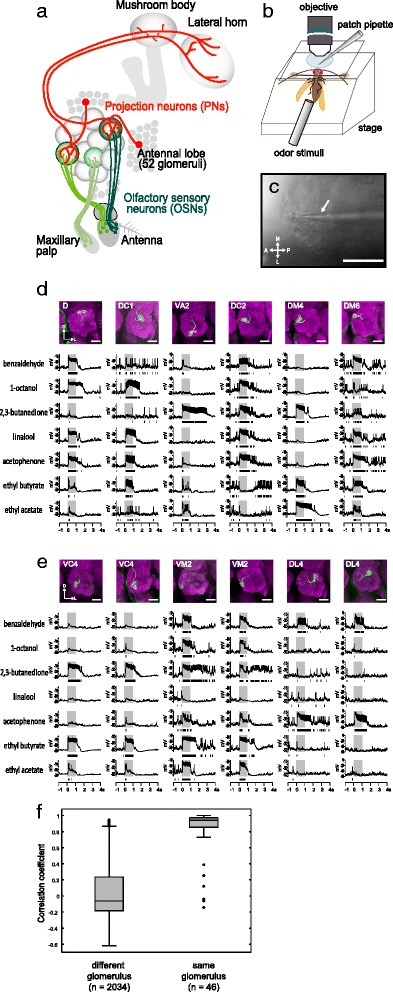
In vivo whole cell patch-clamp recordings from antennal lobe (AL) projection neurons (PNs). a Schematic diagram of the Drosophila olfactory pathway from the periphery to higher brain centers. b Schematic diagram of a fly preparation for in vivo whole cell patch-clamp recording (for details see Methods). c Recordings were obtained from a cell body of a PN. The glass pipette is indicated by the arrow. Infrared differential interference contrast (DIC) view. Scale bar = 50 μm. d Example traces of odor responses of six different class PNs innervating different glomeruli. The gray bars indicate a 1-s odor stimulus period. Raster plots of the spikes are shown under the traces. Morphology of the PNs (top row) showing the dendritic innervation to a glomerulus in the AL in a projection of a confocal stack (PN dendrites: green, nc82: magenta). Scale bar = 20 μm. e Example traces of odor responses of three pairs of PN classes innervating the same glomerulus. The gray bars indicate a 1-s odor stimulus period. Raster plots of the spikes are shown under the traces. Morphology of the PNs (top row) showing the dendritic innervation to a glomerulus in the AL in a projection of a confocal stack (PN dendrites: green, nc82: magenta). Scale bar = 20 μm. f Pearson's correlation coefficient of odor responses between PN pairs innervating the different glomeruli or the same glomerulus
