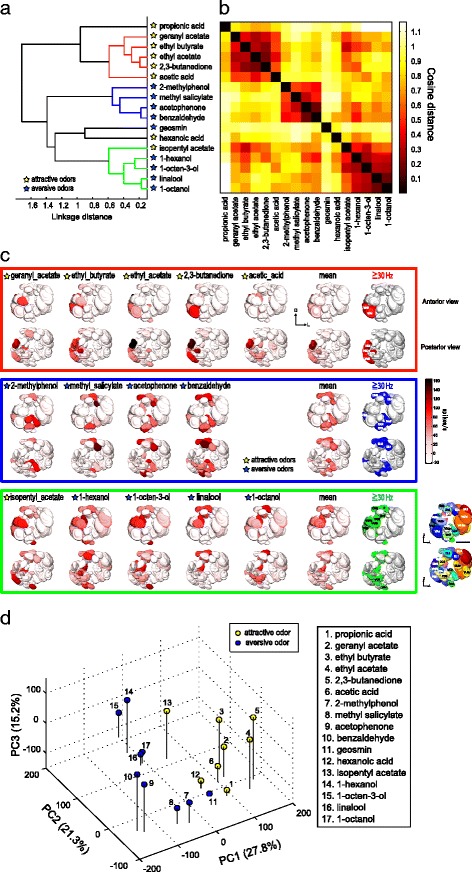
Fig. 4.

Odors are separately represented by different combinations of glomeruli. a Hierarchical cluster analysis for 17 odors based on the cosine distances between odor response intensities of 31 PN classes. The cut-off threshold is set at 0.6 linkage distance, detecting three groups of separately clustered odors colored in red, blue, and green. b A complete distance matrix measured with cosine distances for 17 odors based on odor response intensities of the 31 PN classes. Each axis of the matrix is ordered as in a. c Spatial response patterns for odors clustered in the three clusters in a using odor response intensity of 31 PN classes on a template AL. Mean activation patterns using the average of the odor representation within the same cluster and glomeruli extracted by setting a threshold of 30 spikes/s are shown for three clusters in the right column. Anterior view of the AL (top) and posterior view of the AL (bottom). d Principal component analyses for 17 odors based on the odor response intensities of the 31 PN classes. The percentages of variance accounted by each PC component are shown on each axis
