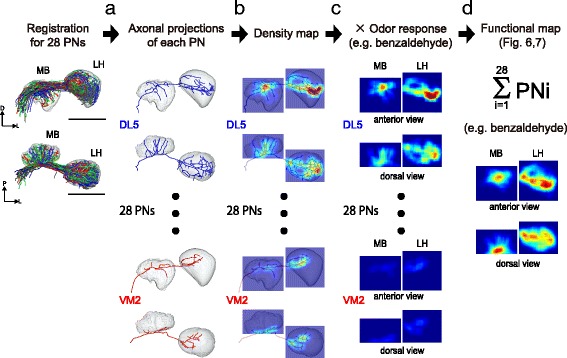
Fig. 5.

Schematic of reconstructing virtual odor activation maps in the MB calyx and LH. a Axons of 28 PN classes were reconstructed and registered to a template MB calyx and LH. b Axonal projections were converted to density maps in the MB calyx and LH. c Density maps were multiplied by the odor response intensity for each odor to generate response maps for each PN. The response to benzaldehyde is shown as a representative example. d The response maps of each PN were summed to generate functional maps in the MB calyx and LH. All calculations were performed for all three dimensions, while the anterior-posterior axis (top) and the dorsal-ventral axis (bottom) are used for visualization
