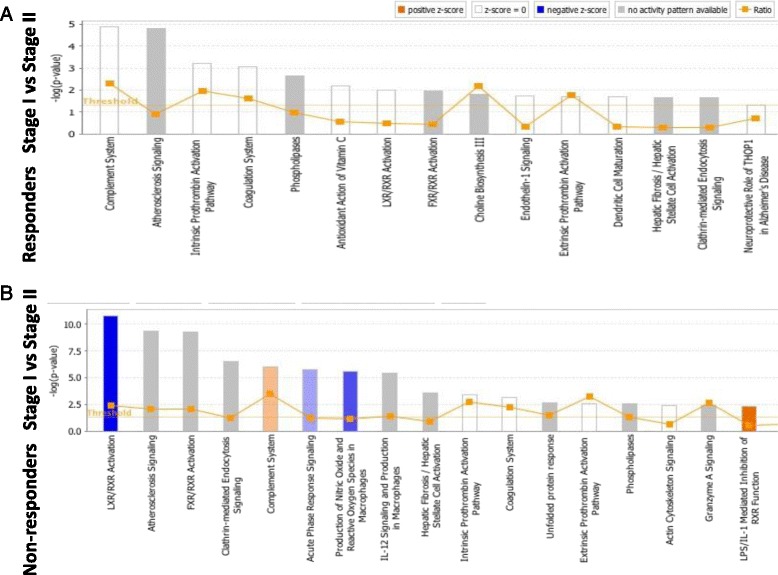
Fig. 2.

Canonical pathways altered in the synovial fluid of responders (a) and non-responders (b) at Stage I compared to Stage II of ACI, identified using Ingenuity analysis, based on proteins which were identified using label-free quantification proteomics (≥1.2-FC). The bars represent the significance of the canonical pathway as calculated by a right-sided Fisher’s exact test; therefore, the tallest bars represent the canonical pathways that are the least likely to have been identified due to molecules being in the canonical pathway by random chance. Canonical pathways which are likely activated (based on the pattern of differentially abundant proteins) are shown in orange and pathways that are likely inhibited are shown in blue
