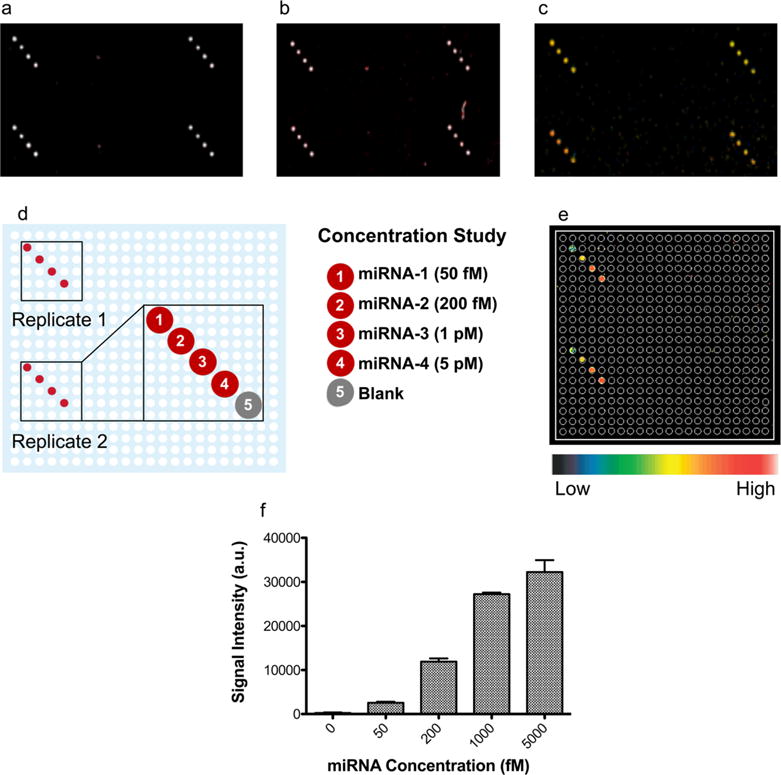
Figure 4.

Analysis of bioassay performance and sensitivity for miRNA detection. Simultaneous visualization of four distinct miRNA sequences at (a) 1 μM, (b) 10 pM, and (c) 1 pM concentrations. (d) Layout of microarray subgrid showing location of miRNA capture sites. (e) Concentration-dependent detection of four distinct miRNA targets. (f) Light scattering signal quantification of biotin—PEG—AuNPs bound to miRNA targets from (e).
