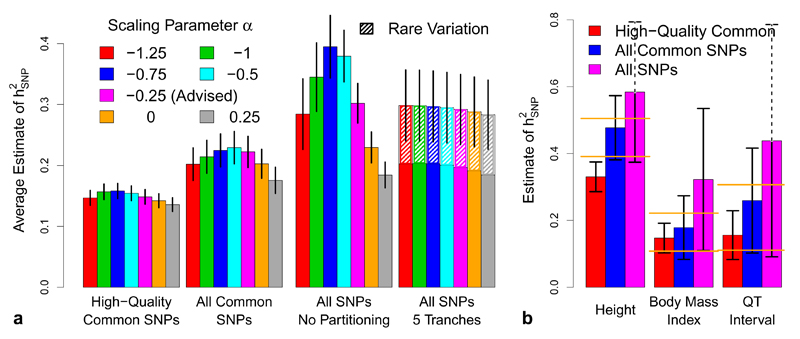
Figure 6. Varying quality control for the UCLEB traits.
We consider three SNP filterings: 353 K high-quality common SNPs (information score > 0.99, MAF > 0.01), 8.8 M common SNPs (MAF > 0.01) and all 17.3 M SNPs (MAF > 0.0005). (a) Blocks indicate SNP filtering; bars report (inverse variance weighted) average estimates of using LDAK (vertical lines provide 95% confidence intervals). Bar color indicates the value of α used. For Blocks 1, 2 & 3, is estimated using the non-partitioned model. For Block 4, SNPs are partitioned by MAF; we find this is necessary when rare SNPs are included, and also allows estimation of the contribution of MAF < 0.01 SNPs (hatched areas). (b) bars report our final estimates of for height, body mass index and QT interval, the three traits for which common SNP heritability has been previously estimated with reasonable precision6 (orange lines mark the 95% confidence intervals from these previous studies). Bar colors now indicate SNP filtering; all estimates are based on α = –0.25, using either a non-partitioned model (red and blue bars) or with SNPs partitioned by MAF (purple bars).

