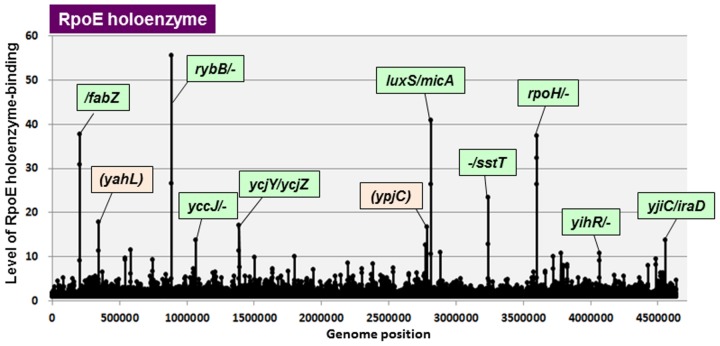
Fig 4. SELEX-chip search for RNAP RpoE holoenzyme-binding sequences on the E. coli K-12 genome.
The y-axis represents the relative number of RpoE holoenzyme-bound DNA fragments whereas x-axis represents the position on the E.coli genome, in base pair. The adjacent gene on E. coli K-12 genome of peak position was indicated for high intensity peaks. The peaks located within spacer regions are shown in green color, while peaks located within open reading frames are shown in orange color. The list of RpoE holoenzyme-binding sites is described in Table 5.

