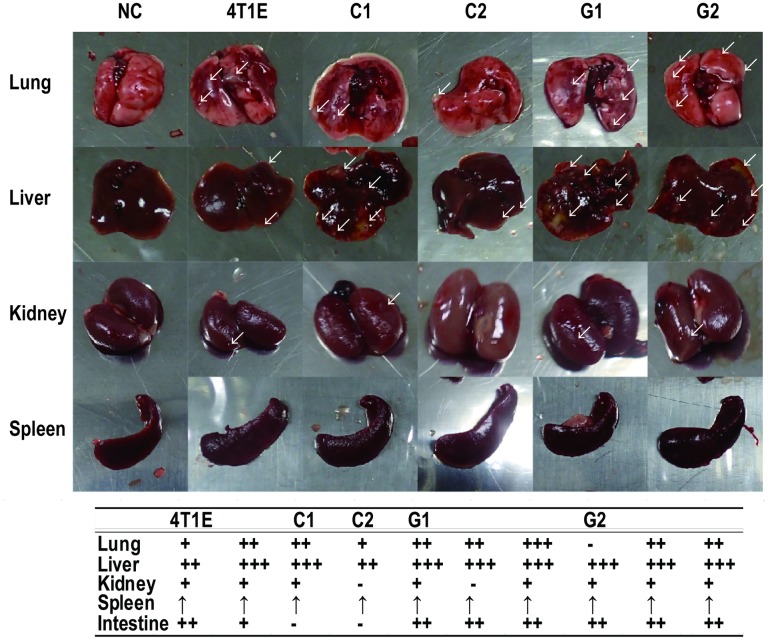
Fig 5. Frequency of metastasis in tissues obtained 38 days post-transplantation of 4T1E cells, and colony- (C1 and C2) and granular-type (G1 and G2) cells separated from 4T1E cells.
Arrows indicate metastatic tumors on the surface of the tissues. The table shows the frequency of metastases confirmed by observation of the dissected tissues. The number of tumors detected in lung, liver, colon, kidney, and intestine is indicated as none (-), one (+), one to five (++), and more than five (+++). The upward-pointing arrows in the table indicate spleen enlargement.

