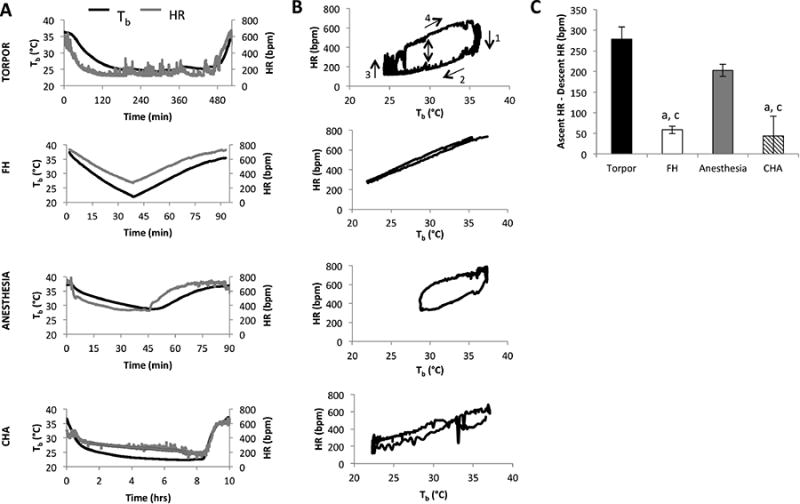
Figure 1. Body temperature (Tb) and heart rate (HR) relationship during bouts of hypothermia.

Mice were implanted with an ECG/Tb telemeter and underwent four different bouts of hypothermia. 1) Natural torpor, induced by chronic 70% caloric restriction at an ambient temperature (Ta) of 22°C. 2) Forced hypothermia (FH), where mice were restrained and exposed to a cold temperature (see Methods). 3) Isoflurane-anesthesia, where mice were kept anesthetized with 2.5% isoflurane in an O2 stream at an Ta of 22°C. 4) ICV injection of the adenosine receptor 1 agonist, cyclohexyladenosine (CHA) at an Ta of 22°C. A. Tb and HR (derived from the ECG tracing) over the bout of hypothermia. B. HR for each condition is plotted as a function of the concurrent Tb. A typical Tb/HR relationship is observed in natural torpor, with time in a clockwise direction, with the beginning of the torpor bout in the top right section of the graph and moving through each of the four steps shown. For the FH condition, the fall in HR during Tb decline closely tracked the rise in HR during Tb rise. Mice treated with CHA also lacked a discernible breadth to their Tb/HR loop with the HR following the same trajectory during body cooling or warming. The Tb/HR relationship in isoflurane-anesthetized mice showed an intermediate breadth. These qualitative assessments were quantified in part C as the difference between HR at a Tb of 30°C while the mouse was recovering from hypothermia and the HR at a Tb of 30°C as the mouse was entering hypothermia.
a = p < 0.05 vs. torpor
b = p < 0.05 vs. FH
c = p < 0.05 vs. isoflurane-anesthesia
