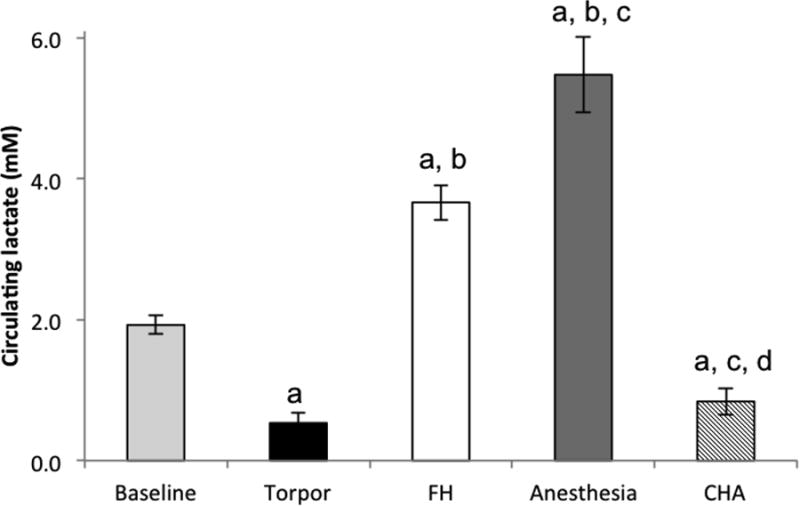
Figure 4. FH and anesthetized mice show signs of anaerobic metabolism, whereas torpid and CHA-treated mice do not.

FH and anesthetized mice show higher circulating lactate levels compared to baseline (taken before treatment). CHA-treated mice and torpid mice show lower than baseline lactate levels.
a = p<0.05 vs. baseline
b = p<0.05 vs. torpor
c = p<0.05 vs. FH
d = p<0.05 vs. isoflurane-anesthesia
